


Pace and route
- Distance
- —
- Moving time
- —
- Total time
- —
- Average speed
- —
- Maximum speed
- —
Análisis de rutas de ciclismo
Routeey brings together the map, timeline, metrics, charts, effort and history so you can understand what happened throughout the ride.
Available metrics depend on the data recorded by your device, sensors or file.
Timeline
Move through the activity to connect each point on the map with the data recorded at that moment.
Loading route…
Play or scrub through it. The marker moves along the route and updates the data recorded at that moment.
Change the perspective. Each selector recolors the same route to reveal pace, effort or terrain.
Real data. This feature preview uses data from the route included in Routeey.
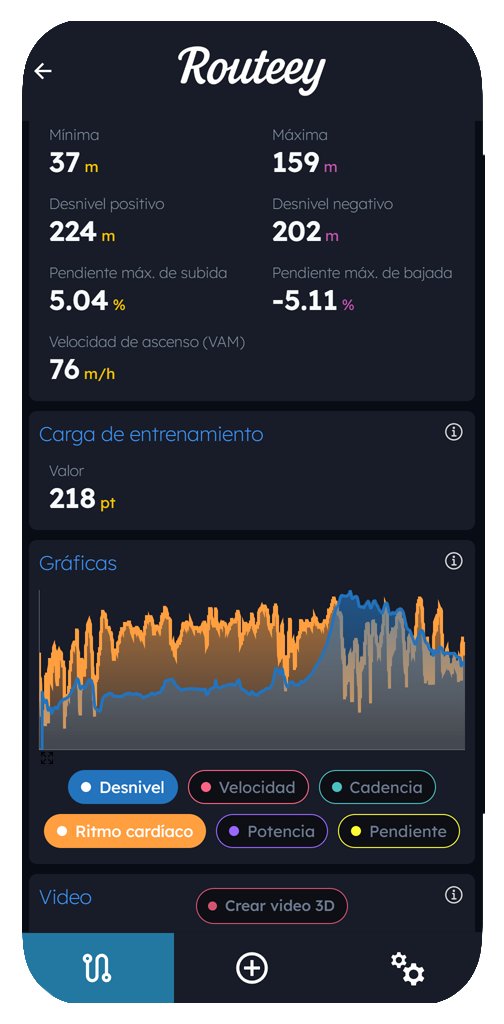
Synchronized charts
Combine the available series to connect the terrain with your response during the activity. Show or hide each metric to focus on what you want to study.
| Distance | Speed | Elevation | Heart rate | Power | Cadence |
|---|
Understanding effort
Routeey organizes the information to separate pace, physical demand and terrain characteristics.
Personal history
When you repeat a route, Routeey places the ride within your own history and helps you see how your results change.
The same route can feel very different depending on the conditions. Routeey shows the context so you can interpret your performance more accurately.
A slower time with a headwind or higher temperatures may be more meaningful than a faster time in ideal conditions. Always consider the context.
Frequently asked questions
Routeey works with the real information available in each activity.
No. You can analyze the map, route, times, speed and terrain without them. Heart rate, power and cadence appear when those data are available.
It depends on what the activity device, sensor, file or provider recorded. Routeey shows the available data without inventing missing values.
Yes. The timeline view lets you move through the activity and connect a route point with its values and charts.
When comparable activities exist, Routeey can show your position, records and history across different metrics. Some features depend on your plan.